The time has come to explore the territory of analyzers of all sorts, which will prove to be very helpful within the context of mastering at home. This week we will deal with the spectrum analyzer, a very useful tool!
Disclaimer
To avoid endless controversies in the comments section of this article, here is a brief clarification. We have no intention of suggesting here that you master with your eyes. Don’t fool yourself, sound is, above all, a matter of the ears. Nevertheless, as we have pointed out many times before in this series of articles dedicated to Home Mastering, listening conditions in a home studio are, most of the time, far below the minimum requirements for good mastering. As a consequence, all tools can be of help as long as you always bear in mind the limitations they bring with them.
Regarding the topic that we are discussing today, you might think that a nice curve in your favorite spectrum analyzer guarantees a perfect job — in fact, it does not. Furthermore, a “perfect curve” doesn’t exist simply because the frequency response depends on the track you are working on. However, this visual feedback can prove to be very useful as long as you know what to look for and how to interpret things in order to improve your master.
Spectral analysis
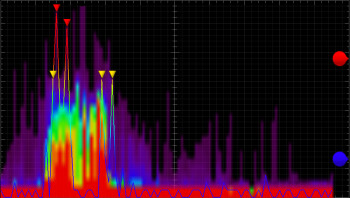
In brief, a spectrum analyzer allows you to visualize, in real time, the frequency response of an audio signal across the entire audible frequency range — namely from 20 Hz to 20 kHz. The main advantage of such a tool is that it offers an objective perspective of the audio spectrum, regardless of the listening conditions. The spectrum analyzer doesn’t care that your speakers don’t go low enough or that your room has a resonance at 647 Hz, it simply shows the reality as it is. It’s particularly interesting because it allows you to work on things that you can’t hear (with less of the “subjective bias” of the ear) or to not try too hard to solve an issue that affects only your room.
There are plenty of real-time spectrum analyzer plug-ins, each with its own particularities. Some allow you to visualize the left/right signals independently, and even mid/side, which is very practical to see what is happening with the stereo image.
Some others often provide zoom options, which can come in really handy for spectral analysis in mastering, where you work at the detail level.
Another interesting feature offered by some plug-ins is the possibility to visualize several frequency responses from different instances of the plug-in within one single window. This can be really useful for gauging the spectral impact of a given processor (EQ, compressor, exciter, etc.). To achieve that, you have to place an instance of the analyzer before and another one after the processor in question.
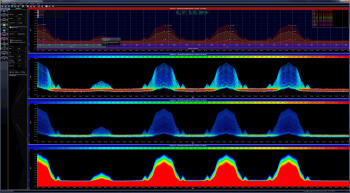
Finally, something we usually forget when using spectrum analyzers is that they’re a very good means to monitor dynamic movements in a given frequency range. They’re formidable tools when working with multi-band compressors.
Tools of the trade
As we already mentioned, there’s no shortage of spectrum analyzers on the market. What’s more, many EQ and multi-band compression plug-ins have a built-in spectrum analyzer. However, a dedicated plug-in often provides more features and much more flexibility of use. Here you have a small, non-exhaustive list of free and paid spectrum analyzers:
- Blue Cat’s FreqAnalyst Pro, Multi and Free
- iZotope Insight
- Voxengo SPAN
- Nugen Audio Visualizer
- VertexDSP MultiInspectorFree


