In this installment, we'll look at the consequences of the loudness war on music, sound and human ears.
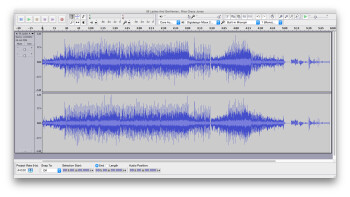
In the previous article I pointed you to a visual example: On the one hand you have the graphical representation of the 1985 hit song “Ladies & Gentlemen, Grace Jones (Slave To The Rhythm)” by Grace Jones and produced by one of the great producers of the time, Trevor Horn. As its name implies, it was a dance hit that was featured in every club back then (and which, given it’s dancing nature, didn’t need to be overcompressed).
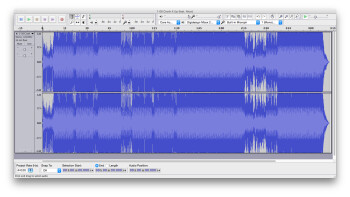
On the other hand, you have a hit from today, “Crank It Up” by David Guetta, featuring Akon on vocals.
This type of graphical representation allows you to gather different information of a waveform: In the horizontal axis is the time and on the vertical one is the volume or amplitude. On the Grace Jones track, the finer lines spiking up and down represent so-called attack transients, peaks, impulses, etc. which correspond to percussive and brief sounds that have a lot of attack. The light blue clusters correspond to mean volume levels. To be more precise, they correspond to the Root Mean Square or RMS level (defined as the square root of the mean of the squares of a sample, got it?), which is commonly used to measure electric current or voltage.
Let’s take a quick look at one of the most serious issues when it comes to measuring audio, namely the representation of perceived volume or loudness. The VU or Volume Unit meter, conceived in 1939 and standardized in the USA in 1942, is one of the first attempts to visualize RMS and perceived volume. A VU-meter can actually measure a sine wave precisely, but not so a complex wave. RMS values, very often found in digital audio, are sometimes considered an approximation to perceived volume, but none of these two measures can represent loudness precisely because the latter is a subjective measure. Noted mastering engineer Bob Katz put it succinctly in this quote from Gearslutz in April 2006: "RMS is just a guide, a VERY rough guide of loudness."
Let’s get back now to the sounds, the peaks. Remember that very brief, percussive sounds contain almost all frequencies. Test it yourself: Take some white noise and apply to it a very short envelope. Here’s a progressive example (with compensation for the loss in volume):

Now let’s go back to the images: On Guetta’s track, it’s hard to identify any transients and the RMS volume shows a rather disturbing regularity.
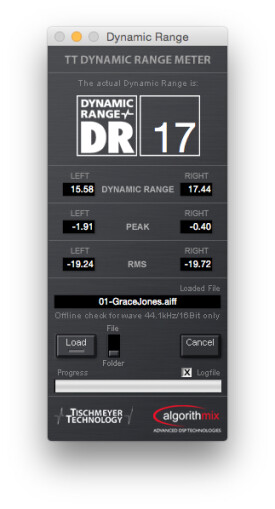
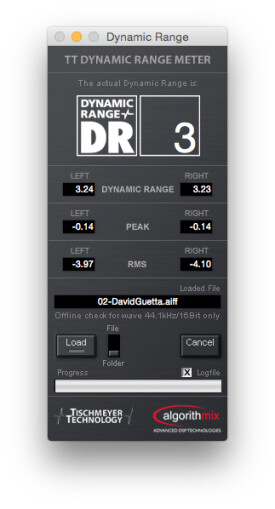
Finally, if you want to talk about hard data, the Grace Jones track has a dynamic range of 17 dB, while David Guetta’s is only 3dB. That difference shows the consequences of the loudness war, in a nutshell. In today’s music market, in order for mixes to compete in terms of loudness, they have to be compressed so heavily that they lose much of their dynamic range.
Perceived volume, measured volume, WTF?
One of the things that causes most confusion, apart from the notion of compression (see the previous article), is the decibel or dB. I’ll try to limit the use of this relative (and logarithmic!) measure to the bare minimum in this article. It is relative because it has to be expressed in relation to another value. This means you can’t talk of two dBs in absolute terms, you need to say what the dBs you are talking about are related to (unlike with two inches, which is something anybody can easily relate to). Moreover, there are as many dBs as things you can measure (dBu, dBW, dB SPL, dBm, dBV, etc.).
You can measure electrical levels and sound pressure levels precisely, but it’s almost impossible to define the sensation of loudness in an exact way (how can you measure “it’s twice as loud or four times as loud”?).
The latest standards (like the EBU-R128) are based on this subjective idea. Nonsense? No, because as soon as you accept the existence of a standard, it is valid for everybody and provides a basis for comparison.
For now simply keep in mind that, in digital audio, you use dB FS (decibel full scale) and dB FSTP (True Peak). These are measures of the greatest possible or admissible value. You can’t exceed them. We’ll see later what the difference is between them.
Simplified measure of the dynamic range
With the intention of bringing together professionals (and not so) against the Loudness War, the Dynamic Range website has gathered information, downloads, and lots of other info on the subject. Together with two software developers, it provides the TT DR Offline Meter for download. A very useful tool that allows you to measure the dynamic range of your favorite albums and songs. You can find it under the Links menu of this site, which also provides a list of albums that have been analyzed with this tool.
It’s very easy to use, you simply need to drag the file or folder of the album (make sure to remove any weird punctuation marks or accents and use only 16 bit, 44.1 kHz) into the upper part of the software. It will then calculate the highest peak (dB FSTP, which explains why the display sometimes indicates “Overs”), as well as a mean value of the 20 loudest RMS values in an histogram made up of 10,000 measures taken every three seconds (with a precision of 0.01 dB). The result of the subtraction (RMS – peak) determines the DR (Dynamic Range).
Even if there are newer standards, this type of measurement remains relevant and retains the idea of comparison. In any case, you ears ought to be the ones to guide you.
Bring the house down?
IMPORTANT NOTE: It is not recommended to use headphones to listen to the audio clips in this and upcoming articles!
Before we continue, let’s do a simple test: First, listen to an excerpt of the Grace Jones track. Set up your system (remember not to use headphones!) in a way that you can hear this excerpt at a volume loud enough for you to feel the punch of the song, without cranking the volume all the way up. The EQ ought to be flat.

Next, cover your ears and listen to the following David Guetta excerpt without touching anything. If you are brave enough, take your hands off your ears for five seconds, but not more than that

Now, go and try to solve the newly created conflict with your neighbors and then come back to read the next installment.
Download the AIFF files (in a ZIP)


